One of the projects my team at Netflix is busy with is improving the end-user performance experience. Anyone that reads my blog regularly knows that I am a champion for great user experiences. Often the performance angle is not included in discussions of the user experience. But as we all know the best design can be crippled by sluggish execution, waiting a long time for a page to be fully interactive or feedback that does not come in a timely manner.
Timing "from Click to Done" - Full Cycle ExperienceUser performance experience focuses on what is the full cycle time from when the user requests a page or invokes an action till a new page is ready for interaction or the action has completed. Most sites have various ways of tracing parts of the performance puzzle. Often backend instrumentation is inserted to time backend services. But a lot of sites don't have a complete picture of just how much time is the user spending from the time
they click it till the time they get it back (done).
To address this issue at Netflix, one of the first things I initiated after joining Netflix was the creation of full cycle tracers. Kim Trott (on my team) took the idea, ran with it, fleshed it out and turned it into reality.
The idea of tracing the full cycle time is to:
- Capture the start time
- Capture various points of interest
- Capture the end time
- Log the results
Capture the Start Time ("from Click")To get a full cycle time we need to capture the point in time the user makes a request.
At Neflix we use the following stack of technologies: Java, JSP, Struts2, Tiles2, HTML, CSS and Javascript. Within the normal HTTP request/response cycle our requests are handled via Java servlets (eventually routing through to JSP for Web pages).
") Unload Event
Unload Event The most logical place to measure the start of a request ("from Click") is on the originating page (see
A in figure above). The straighforward approach is to add a timing capture to the unload event (or onbeforeunload). More than one technique exist for persisting this measurement, but the most common way is to write the timing information (like URL, user agent, start time, etc.) to a cookie.
However, there is a downside to this methodology. If the user navigates to your home page from elsewhere (e.g., from a google search), then there will be no "start time" captured since the unload event never happened on your site. So we need a more consistent "start time".
Start of Servlet Response We address this by providing an alternate start time. We instrument a time capture at the very earliest point in the servlet that handles the request at the beginning of the response (see
B in figure above). This guarantees that we will always have a start time. While it does miss the time it takes to handle the request, it ends up capturing the important part of the round trip time -- from response generation outward.
There are a number of ways to save this information so that it can be passed along through the response cycle to finally be logged. You can write out a server-side cookie. You can generate JSON objects that get embedded in the page. You could even pass along parameters in the URL (though this would not be desirable for a number of reasons). The point is you will need a way to persist the data until it gets out to the generated page for logging.
Note that the absolute time captured here is in server clock time and not client clock time. There is no guarantee these values will be in sync. We will discuss how we handle this later.
Capture Intereresting Points Along the WayAfter capturing the start point there are a few other standard points of time we would like to capture.
")
Two points of interest are captured on the servlet side:
- When we begin generating the HTML for the page (C)
- When we end generating the HTML for the page (E)
Two points of interest are captured on the client side:
- When start rendering the HTML for the page (D)
- When we end processing the HTML for the page (F)
C &
E deal with page generation.
D &
F deal with page rendering.
In
D, we emit a scriptlet immediately after emitting the <HEAD> tag that saves
new Date()).getTime() into a Javascript object on the page.
In
F, we emit a scriplet immediately after emitting the </BODY> tag that saves
new Date()).getTime() into a Javascript object on the page.
When the page starts rendering the HEAD it will execute
D and store the time stamp. When the BODY finishes rendering, it will execute
F and store the time stamp.
Capture End Time ("to Done")Once
F is finished however, this does mean that the page is completely rendered. In parallel, the browser has been loading CSS, Javascript, requesting images and rendering the page. But the page is not ready for the user to interact with (typically) until the
onload event is finished for the page (see
G in diagram below).
")
We attempt to insert our instrumentation as the very last item to be handled in the onload event for the page.
Logging the Captured TimesHere is a diagram that shows the various time points we capture (8) and the measures we derive (5).
")
The five measurements are:
- Elapsed client request time (G-A). Full cycle time. The total time it took to request the page, receive the response and render the page. Not available if the referring page is not a Netflix page. This is not available for all measurements.
- Elapsed server response (E-B). How much time was spent generating the server response.
- Elapsed client render (G-D). How much time it took the client to render the page (and get the server response). Since we stream our response to the client, there's no way to differentiate how much of the client rendering time was spent getting the response from the server vs. rendering the page. The browser will start to render the page as it receives the content from the server.
- Elapsed server plus client (C-B) + (G-D). Total time to render; full time to generate the response and render it client-side. This is the key measure we use as it includes the most reliable start time (that we can capture all the time). It is the summation of the client render time (G-D) and the elapsed server response (C-B). By taking the deltas on the client and the server separately we can safely add their values together to get a total time (even though they are captured in different server clock times). The caveat is there can be some gap between the time C emits the HEAD tag and the corresponding Javascript time stamp and the time D starts rendering. In practice we have found this time to be sufficiently small on the whole so have kept to this simple approach.
- Elapsed client render after body (G-F). This gives us an idea of how much additional time is needed to get the page fully loaded after rendering the body.
At this point we can gather up the five values (persisted so far via server-side and client-side cookies or some other methodology) and write these out to a server log. This could be done via an Ajax call, using
beacons, an
HTTP request with a NO-CONTENT response or some other mechanism. The back end service caches up results and writes them to a database for later analysis.
The Benefit of MeasuringWe could have chosen to implement all the yslow
performance suggestions without measuring anything. Most likely they would all be wins for us. But by putting a full user experience performance tracing mechanism in place we can be confident that enhancements, features, or even attempts at performance improvement did not negatively affect site performance.
Recently we fielded a different variation of our star ratings widget. While it cut the number of HTTP requests in half for large Queue pages (a good thing) it actually degraded performance. Having real time performance data let us narrow down on the culprit. This feedback loops is an excellent learning tool for performance. With our significant customer base, large number of daily page hits we can get a really reliable read on the performance our users are experiencing. As a side note, the
median is the best way to summarize our measurements as it nicely takes care of the outliers (think of the widely varying bandwidths, different browser performance profiles that can all affect measurements.)
In future articles - Discuss what has worked and not worked.
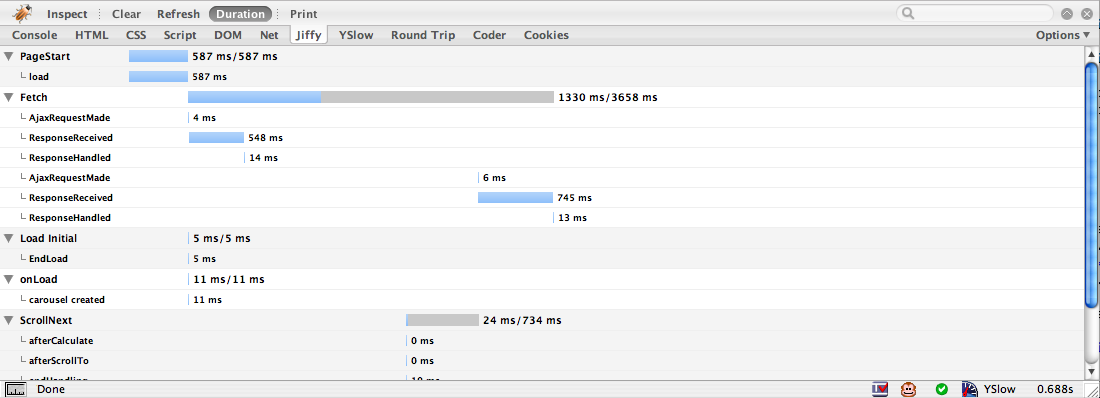
- Discuss an internal firebug extension I wrote to visualize this data for our developers.
- Compare Safari vs Firefox vs IE -- the results are really interesting.
- Announce a new Firebug Extension that helps visualize performance page data.
Hear More About this at the Velocity ConferenceAs I mentioned in my previous article I will be giving a 15 minute talk on
Improving Netflix Performance at the
Velocity Conference. I will cover some of this material as well as other information in that talk.
CreditThanks to my excellent UI Engineering team at Netflix, in particular the hard work of Kim Trott. Thanks also to the
yslow team for giving us some concrete ideas on improving site performance.
")